
This article has been published 6 years ago. If you're into internet archeology, read it — but at your own risk. Honza doesn't have to necessarily agree with the content by now.
I wanted to continuously monitor "frontend performance" of my website, so I could get notified about drops or improve the scores over time. This article is about how I hacked a custom solution using a tool called Lighthouse and a CI as a service I use, CircleCI. It's just quick notes, so no editing, no reviews, not many grammar checks, but hopefully it's gonna be useful nevertheless.

The problem
I'm working on a website for juniors in tech, junior.guru (the content is Czech only so far, I'm sorry). From the deployment perspective, it's a static website in the most traditional sense. It's just files, HTML, CSS, and a very little amount of vanilla JavaScript.
As the website grows, I ponder about my options regarding JavaScript frameworks and deployment. However, whatever I choose, I want to be sure that my website stays slim, fast, and accessible.
It's a small project in an early stage, so it's common for me to cut corners for the sake of getting things done. However, I honor the Golden rule: "What you do not wish for yourself, do not do to others." I dislike advertisements and pop-ups, so there are none in my projects. I dislike slow and bloated websites, so I don't want my projects to fall in that category.
Also, I believe that performance and accessibility sells. My project is a content website. I think fast and accessible content websites attract more visitors and potentially lead to more conversions.
Idea from Guillermo Rauch
I follow @rauchg on Twitter and he often boasts in his tweets about how Next.js is performant, using charts from some tool called Lighthouse.
So, @datocms + Next.js + @vercel is… glory https://cms-datocms.now.sh/
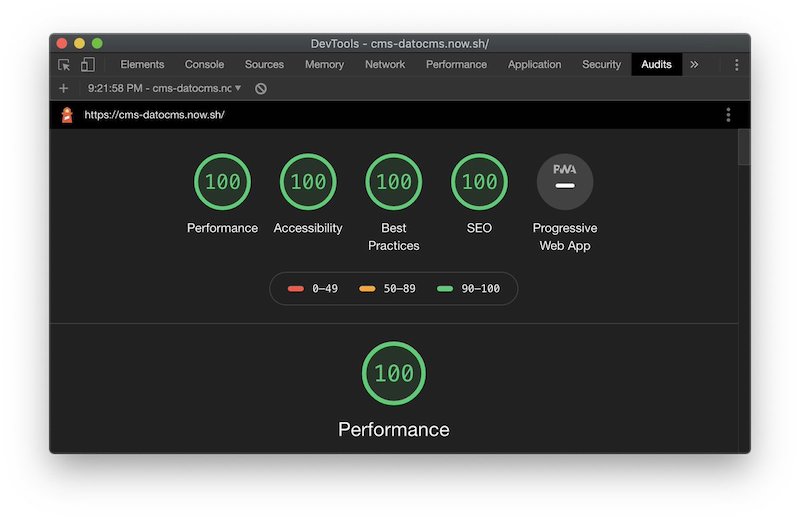
Ever since I started thinking about the problem presented above, seeing one of these charts always made me think: "Yes, I want this for my website! But as a continuous monitoring."
My idea was I could put this somehow to my CI pipeline and check my website under each Pull Request, or more likely in a nightly build. Ideally, it would produce an HTML report, but also I could set limits for the numbers and if the scores drop, the build would fail.
Is there an easy way I can put https://web.dev/measure/ to my @CircleCI? Nightly or weekly test which breaks the build if my site drops in performance, accessibility, etc.
Today I had a few hours left at the end of day, so I decided I could develop a prototype of such monitoring.
Solution by a Python script
I found the tool and to my pleasant surprise, it's an Open Source tool one can install by npm install lighthouse. As simple as that! The fact that Lighthouse has support for multiple reporters and can report not only HTML, but JSON as well, was another pleasant surprise. I also found an article about how it can be ran in CI. Great! Now it's just a matter of gluing things together with a bit of Python.
First, prepare a directory for the reports. Standard library pathlib and shutil come handy:
import shutil
from pathlib import Path

LIGHTHOUSE_DIR = Path(__file__).parent.parent / 'lighthouse'

shutil.rmtree(LIGHTHOUSE_DIR, ignore_errors=True)
LIGHTHOUSE_DIR.mkdir(parents=True)
Now I need a list of URLs to check:
from pathlib import Path

PUBLIC_DIR = Path(__file__).parent.parent / 'public'

def html_path_to_url(path, public_dir):
    path = str(path).rstrip('index.html')
    path = str(Path(path).relative_to(public_dir))
    return f"https://junior.guru/{'' if path == '.' else (path + '/')}"

def get_urls(public_dir):
    return [html_path_to_url(path, public_dir)
            for path in Path(public_dir).rglob('*.html')
            if '/admin/' not in str(path)]
The get_urls() function walks through .html files in the public directory, where the static site lives, and then generates a production URL for each of them. Now there is a function which takes care of the check itself:
import json
import sys
from subprocess import run

MIN_SCORES = {
    'performance': 75,
    'accessibility': 60,
    'best-practices': 90,
    'seo': 85,
}

def check_url(url):
    print(f'[CHECK] {url} → {url_to_html_report_path(url)}', file=sys.stderr)

    outputs = ['--output=json', '--output=html',
               f'--output-path={url_to_report_name(url)}']
    command = ['npx', 'lighthouse', '--quiet', '--chrome-flags=--headless']
    command += outputs + [url]
    run(command, check=True)

    report = json.loads(Path(url_to_json_report_path(url)).read_text())
    return url, get_scores(report['categories'])

def get_scores(categories):
    return {score_id: int(category['score'] * 100)
            for score_id, category in categories.items()
            if score_id in MIN_SCORES.keys()}
The function takes a URL and prints it out so I have an idea of a progress when watching the script run. Then it composes a npx lighthouse ... command with all the parameters. It runs the command as a subprocess. Lighthouse generates an HTML report as well as JSON report. The Python script reads the JSON, finds the part with scores called categories, and reads the scores. Actually, only the scores for which I've set minimum values. The JSON carries the scores as floating point numbers, so they need to be multiplied with 100: 0.98 becomes 98
Lighthouse deals with report formats and report output paths in some funky way, so I had to create a few helper functions to set the right values to the right places:
from slugify import slugify

def url_to_report_name(url):
    return LIGHTHOUSE_DIR / slugify(url).lstrip('https-')


def url_to_json_report_path(url):
    return f'{url_to_report_name(url)}.report.json'


def url_to_html_report_path(url):
    return f'{url_to_report_name(url)}.report.html'
Here I use python-slugify, which is the only external dependency of the script. At this point, I'm ready to do the main job:
checks = list(map(check_url, get_urls(PUBLIC_DIR)))
print('')

failing = 0
passing = 0
for url, scores in checks:
    for score_id, min_score in MIN_SCORES.items():
        if scores[score_id] < min_score:
            print(f'[FAIL] {url} {score_id}: {scores[score_id]} (min: {min_score})')
            failing += 1
        else:
            passing += 1

print(f'\nFailing: {failing}\nPassing: {passing}')
sys.exit(1 if failing else 0)
For each check, I compare whether the scores are lower than my limits or not, and evaluate whether the page passes or fails. I print out failed pages and then a short summary. If there are any failed pages, I exit the script with a code 1, which tells the operating system, and especially the CI, that something went wrong.
Because the checks are very slow, the script could use a bit of parallelization. That's easy to achieve by replacing map() with Pool().map() from Python's multiprocessing. It automatically detects how many cores my processor has and spawns as many "workers" to process the items in parallel.
from multiprocessing import Pool

checks = Pool().map(check_url, get_urls(PUBLIC_DIR))
Because I develop my project as Open Source, you can see the whole script on GitHub. The result looks like this:
$ python scripts/check_performance.py
[CHECK] https://junior.guru/donate/ → lighthouse/junior-guru-donate.report.html
[CHECK] https://junior.guru/ → lighthouse/junior-guru.report.html
[CHECK] https://junior.guru/jobs/2a9bf335f621d61cbbe8cede61609f162900b5a066ffe8030e21ac73/ → lighthouse/junior-guru-jobs-2a9bf335f621d61cbbe8cede61609f162900b5a066ffe8030e21ac73.report.html
[CHECK] https://junior.guru/jobs/ → lighthouse/junior-guru-jobs.report.html
[CHECK] https://junior.guru/jobs/17b0e80e3289f1e4831a3d2f1fe108a80d6265e18ce48a982df68abe/ → lighthouse/junior-guru-jobs-17b0e80e3289f1e4831a3d2f1fe108a80d6265e18ce48a982df68abe.report.html
[CHECK] https://junior.guru/privacy/ → lighthouse/junior-guru-privacy.report.html
[CHECK] https://junior.guru/jobs/f9981c1e511476da731df99b7f1acece29d7e7eb501279fa620e6475/ → lighthouse/junior-guru-jobs-f9981c1e511476da731df99b7f1acece29d7e7eb501279fa620e6475.report.html
[CHECK] https://junior.guru/jobs/36088d5962e330d825212aa223a2fb90d836f275c44aaffdf5841201/ → lighthouse/junior-guru-jobs-36088d5962e330d825212aa223a2fb90d836f275c44aaffdf5841201.report.html
[CHECK] https://junior.guru/jobs/b309e891a1b9e28e37325e394c366329498373cda2ebc0dd3f919cb2/ → lighthouse/junior-guru-jobs-b309e891a1b9e28e37325e394c366329498373cda2ebc0dd3f919cb2.report.html
[CHECK] https://junior.guru/thanks/ → lighthouse/junior-guru-thanks.report.html
[CHECK] https://junior.guru/learn/ → lighthouse/junior-guru-learn.report.html
...
[CHECK] https://junior.guru/jobs/eab9db6d183329cb84fa816b7780e1a05b4210c135da7b3ffcc067b5/ → lighthouse/junior-guru-jobs-eab9db6d183329cb84fa816b7780e1a05b4210c135da7b3ffcc067b5.report.html


Failing: 0
Passing: 176
Continuous monitoring
My project uses CircleCI for building and various checks. I added one job to the configuration for my new Lighthouse check:
...
executors:
  python-js:
    docker:
      - image: circleci/python:3.7-node-browsers
    working_directory: ~/project
...

jobs:
  ...
  check-performance:
    executor: python-js
    steps:
      - attach_workspace:
          at: "~"
      - run: pipenv run check-performance
      - run:
          command: tar -cvzf lighthouse.tar.gz ./lighthouse
          when: always
      - store_artifacts:
          path: ./lighthouse.tar.gz  # HTML and JSON reports from lighthouse
...

workflows:
  version: 2
  ...
  nightly_workflow:
    ...
    jobs:
      ...
      - check-performance:
          requires:
            - deploy
It's important I use the CircleCI's python:3.7-node-browsers Docker image, which contains Python as well as Node.js and browsers, because Lighthouse depends on having Google Chrome installed. In the job itself I run the script through pipenv (to be precise, through the scripts section of Pipfile), compress the directory with reports, and store it as an artifact. If the script fails the build and I won't be able to reproduce the problem locally, I can download the archive from CircleCI and inspect the actual reports made on CI. I've put the job into my nightly workflow, so that it runs every night, and I've set it to depend on my deploy job, which deploys the site to production as this is effectively a production check.
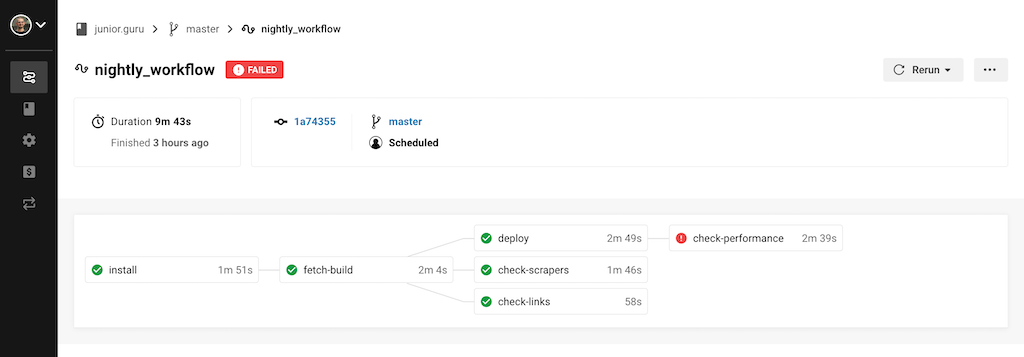
If the job fails, it doesn't affect whether the site gets re-deployed or not, but I get notified by e-mail, which works great as poor man's monitoring. That's about it. Again, you can see the whole change here.
Memory issues on CircleCI
Soon I figured out the parallelization doesn't work well on CircleCI. The build interface declares my container is 2 CPU / 4 GB RAM, but I got Google Chrome timing out with some memory issues in the log when running a few of them in parallel by Pool().map():
ENOMEM: not enough memory, read
ENOMEM: not enough memory, read
ENOMEM: not enough memory, read
ENOMEM: not enough memory, read
Runtime error encountered: spawnSync /bin/sh ENOMEM
I ended up with a silly hotfix, which tests whether there is a CI environment variable set (CI services usually set it to allow detection like this). If the script is running on CI, it uses the map() function, otherwise Pool().map():
import os

map_ = map if os.getenv('CI') else Pool().map
checks = list(map_(check_url, get_urls(PUBLIC_DIR)))
I introduced the parallelization mainly to shorten the duration of the script locally. I don't really care how much time the CircleCI job takes, as it's gonna happen when I sleep, right? When I tried this version of the script, it passed! But it took 8 minutes. That's not great. What if I need to debug something and I want to retry the build a few times? What if my website gets 20 more pages?
Searching for the memory error message together with "CircleCI" and "Google Chrome" got me to a section Running Puppeteer on CircleCI in the Puppeteer docs. Puppeteer is a tool which allows Node.js programs to control (headless) Google Chrome, which is very likely exactly what Lighthouse does under the hood. The section gives a hint that usual detection mechanisms think that a CircleCI container has 36 cores, rather than the declared 2. And I was able to confirm that by print('Cores:', multiprocessing.cpu_count()) and running the script on CircleCI. Wow! Okay. This brought me to a better hotfix:
from multiprocessing import cpu_count, Pool

pool_size = min(cpu_count(), 4)  # CircleCI declares 2, but detection reads 36
checks = Pool(pool_size).map(check_url, get_urls(PUBLIC_DIR))
Despite CircleCI declares 2 CPU, I decided to set the minimum pool size to 4, because if my extremely non-performant early 2015 laptop is able to spawn 4 parallel checks while simuntaneously running Firefox and Visual Studio Code, I bet the CircleCI container can do 4 too. And so far it seems to cope well! Now the job takes 2m 18s.
Summary
The Lighthouse's README mentions various other projects and tools which could compete with my solution. For example, there's Lighthouse Keeper, which continuously monitors up to 3 URLs for free. I didn't want to depend on a 3rd party service when I've seen how easy it is to setup my own thing, and my site already has more than 3 URLs to monitor.
I've set the minimum scores to minimum values I observed during the first run of my new script, so the site should now always pass the check. However, with such check in place I get the following benefits:
- If I modify my website in any way, I'll know if performance, accessibility, or SEO drop.
- From time to time I can look at the reports, try to fix some of the problems, and then set the bars higher.
I hope this article contributes to a better world, because now you have no excuse not to monitor how bloated and inaccessible your website is!
